Újrahasznosítás
English Only! Download PDF The problem
![]()
![]()
Policy Relevance
![]()
![]()

Good Experience
The Problem
In 2004, waste accounted for about 3% of GHG emissions. Thus, sustainable waste management impacts on climate change could contribute towards the reduction of C02 emissions by prevention first of all. Prevention, in fact, means savings of energy, resources and natural services.
That's why the European Environmental Agency has produced a report on Waste Management Options and Climate Change which shows that “overall, source segregation of MSW followed by recycling (for paper, metals, textiles and plastics) and composting/AD (for putrescible waste) gives the lowest net flux of greenhouse gases, compared with other options for the treatment of bulk MSW”.
The best option is recycling materials from separate collection because “recycling avoids the emissions associated with producing materials recovered from the waste from primary resources” and “use of compost avoids emissions associated with the use of any peat or fertiliser that it displaces” These are the main findings of a study undertaken for the European Commission Environment Directorate General by AEA Technology.
A recent research shows that “establishing EU-wide legally binding recycling targets for municipal solid waste could save up to 144 million tonnes of CO2 per year” (Source: Oekopol)
Waste is an indicator of a non-efficient system. It is a precise mirror of our way of life, of our production and consumption patterns. Each product, before and during manufacturing, leaves an amount of waste beyond itself. In the same way, what we buy, sooner or later, turns to waste.
The waste problem is directly linked to the problem of resources consumption, or non renewable resources depletion. Thus resources and waste are different faces of the same problem.
Life in European Countries is based on very high resource consumption: in the EU-15, every citizen uses about 15-16 tonnes of resources (for buildings, fossil fuels and biomass). About a third of this amount turns into waste. That means an average of 4 millions tonnes per each person in the EU. In EU-27, it is 6 tonnes per capita. This is the flow of industrial waste. [ ^ Back to Summary ]
M unicipal solid waste - the waste we produce at home - is about 522 Kg per capita, every year. And the amount of municipal waste is expected to grow by 25 % from 2005 to 2020 . It's not only a problem of quantity, but also of quality. Waste could contain hazardous substances.
Waste production growth depends on economic growth, on changes in consumption and production trends, on technology evolution. Waste is a problem because it contains hazardous substances and because it means that we throw away an enormous amount of resources. Last but not least, waste needs to be managed and it is a cost for local communities. To get an overview on costs, there is a study from the European Commission which analyses different options of waste management at a local and national level in the EU-15 (see in bibliography). [ ^ Back to Summary ]
Policy Relevance
Directive on Landfill (99/31) which is intended to reduce or minimize the negative impact of waste disposal on the environment
For such a large amount of waste, the general suggestion is to break the link between growth in GDP and waste. How? There are a lot of solutions: for instance, producing with less energy input and resources; changing our behaviour and our consumption habits.
In coping with the waste problem, at a European level, there are strategies, policies and directives. All the documents related to waste strategies and cross cutting policies (sustainable use of resources) are easy to find on the web site of the European Environment Agency. Landfill of waste became more expensive and, as a counter, recovery and recycling became less expensive for local communities.
The target by 2016 is for a 35% reduction (of 1995 levels) of landfill bio-waste; untreated bio-waste produces methane, a greenhouse gas with high potential for climate change. [ ^ Back to Summary ]
Legal framework on waste in Directive 2008/98 where one finds the hierarchy of priorities between waste management options and indications on good behaviours for prevention of production
In the EU is Directive 2008/98 on waste in which it is stated that: “The first objective of any waste policy should be to minimise the negative effects of the generation and management of waste on human health and the environment. Waste policy should also aim at reducing the use of resources, and favour the practical application of the waste hierarchy”.
This hierarchy has been, in principle, the same for many years, and it is to be read as a list of priorities amongst waste management options:
- prevention;
- preparing for re-use
- recycling
- other recovery, e.g. energy recovery (see disposal
In fact, data show that at a local level, the options are upside down. In the EU27 in 2007, 42% of treated municipal waste was landfilled, 20% incinerated, 22% recycled and 17% composted. Some highlights from the press release stat/09/31 (09/03/2009): “highest share of municipal waste recycled in Germany, Belgium and Sweden. The treatment methods differ substantially between Member States. In 2007, the Member States with the highest share of municipal waste landfilled were Bulgaria (100% of waste treated), Romania (99%), Lithuania (96%), Malta (93%) and Poland (90%).The highest shares of incinerated municipal waste were observed in Denmark (53%), Luxembourg and Sweden (both 47%), the Netherlands (38%), France (36%), Germany (35%) and Belgium(34%). Eleven Member States had no incineration at all. The Member States with the highest recycling rates for municipal waste were Germany (46%), Belgium (39%), Sweden (37%), Estonia and Ireland (both 34%).Composting of municipal waste was most common in Austria (38%), Italy (33%), Luxembourg and the Netherlands (both 28%), and not done at all in Bulgaria, Cyprus and Romania. Composting and recycling accounted for over 50% of municipal waste treated in Germany (64%), Belgium (62%), the Netherlands (60%) and Austria (59%)”.
| Municipal waste treated, %: | |||||
| M.W. kg per person | Landfilled | Incinerated | Recycled | Composted | |
| EU27 | 522 | 42 | 20 | 22 | 17 |
| Belgium | 492 | 4 | 34 | 39 | 23 |
| Bulgaria | 468 | 100 | 0 | 0 | 0 |
| Czech Republic | 294 | 84 | 13 | 2 | 1 |
| Denmark | 801 | 5 | 53 | 24 | 17 |
| Germany | 564 | 1 | 35 | 46 | 18 |
| Estonia | 536 | 64 | 0 | 34 | 2 |
| Ireland | 786 | 64 | 0 | 34 | 2 |
| Greece | 448 | 84 | 0 | 14 | 2 |
| Spain | 588 | 60 | 10 | 13 | 17 |
| France | 541 | 34 | 36 | 16 | 14 |
| Italy | 550 | 46 | 11 | 11 | 33 |
| Cyprus | 754 | 87 | 0 | 13 | 0 |
| Latvia | 377 | 86 | 0 | 13 | 1 |
| Lithuania | 400 | 96 | 0 | 2 | 2 |
| Luxembourg | 694 | 25 | 47 | 0 | 28 |
| Hungary | 456 | 77 | 9 | 13 | 1 |
| Malta | 652 | 93 | 0 | 2 | 5 |
| Netherlands | 630 | 3 | 38 | 32 | 28 |
| Austria | 597 | 13 | 28 | 21 | 38 |
| Poland | 322 | 90 | 0 | 6 | 4 |
| Portugal | 472 | 63 | 19 | 8 | 10 |
| Romania | 379 | 99 | 0 | 1 | 0 |
| Slovenia | 441 | 66 | 0 | 34* | -- |
| Slovakia | 309 | 82 | 11 | 2 | 5 |
| Finland | 507 | 53 | 12 | 26 | 10 |
| Sweden | 518 | 4 | 47 | 37 | 12 |
| United Kingdom | 572 | 57 | 9 | 22 | 12 |
Source: Eurostat
Some of the data is estimated
* Recycling data for Slovenia includes composting
Prevention
The highest priority in the hierarchy is prevention, i.e. reduction at the source However, the initiatives which have been taken so far have not reduced the regular annual increase in total waste across Europe (Source: Study on “Potentials for the prevention of municipal solid waste”).
The EU Directive obliges Member States to establish waste prevention programmes no later than 12th December 2013 with specific waste prevention objectives. Some countries have already planned Prevention programmes (e.g. Scotland)
In any case, everybody can be active in preventing waste production or saving resources: Public administration, industry, retailers and individuals.
Industry can be cleaner by taking a Life Cycle approach. A Life Cycle approach means taking into account the impact on the environment of the material extraction to disposal phase. This is a matter of Ecodesign (see box below: Ecodesign criteria).
The production process can be cleaner with less energy and material input and less impact on the environment throughout the whole process (For more information read Green Company document)
Ecodesign criteria towards a low waste impact:
Design should be implemented for:
|
*Energy user products are targets for a specific Directive 2005/32
Some Suggestions
Individuals can choose to buy eco-friendly products to minimize their waste.
What do I look for when I buy? See box ´I love shopping´
| I love shopping (bringing my own bag): Products with Eco-label or national label (blue Angel – Germany; Nordic Swan for Scandinavian States) Unpackaged products Single material packaging Not over-packaged Not single use products Not one-dose Large packages Refillable containers Eco-cartridge Concentrated products |
Re-use
In preventing waste production, the capability of re-using items or giving products a second life is very important. Warning! Waste is what we decide mostly to throw away (legal definition: Waste means any substance or object which the holder discards or intends or is required to discard), but it is quite possible that our “no good any more” product could be useful or helpful to somebody else. In this way, we can lengthen the life of our product.
Many items can be re-used – from carrier bags and clothes through to books and furniture.
Re-using an object uses far less energy than recycling it and it is much kinder on the environment.
Minimizing the amount of waste
Composting in one’s own garden is very important towards avoiding the input of new waste in the flow stream. Many local councils have encouraged this kind of home waste treatment, with lower taxes for household waste and by education programmes for interested people.
Recycling
The Directive sets out targets for recycling in article 11: In order to comply with the objectives of this Directive, and move towards a European recycling society with a high level of resource efficiency, Member States shall take the necessary measures designed to achieve the following targets:
- by 2020, preparing for re-use and the recycling of waste materials such as paper, metal, plastic and glass from households at least and possibly from other origins as far as these waste streams are similar to waste from households, shall be increased to a minimum of overall 50 % in weight.
Waste stream Household waste could be separated in different streams: Packaging (all materials: wood, aluminium, glass, plastics, paper and cardboard), bio-waste (kitchen and garden scrap) bulky waste, electric and electronic waste, oils, hazardous waste such as medicines, batteries.
The local authorities are responsible for collection of these different streams. They have to organise separate collection and to bring materials to recycling facilities (glass factories, foundries etc.).
All that can’t be recycled, is incinerated (burnt) in special facilities providing energy and, in some cases, heat recovery . At least, theoretically, residues are very light and they have to be landfilled. There is a high variability of collection systems set out across Europe, but the best results, in terms of quality and quantity of collected materials for recycling, comes from the door to door system. This means that every household has its own takeaway site, just outside the door.
Local authorities have the choice to encourage separate collection through economic incentives for households (tariffs on the quantity of waste produced), through continuous education campaigns for reduction, and proper separation. Local authorities, in stimulating the green market (products derived from recovered materials amongst other things) can apply the GPP (Green Public Procurement).
For more see ec.europa.eu/environment/gpp/index_en.htm
[ ^ Back to Summary ]
Packaging and Packaging Waste Directive (94/62/EC, revised in 2004 by an amending Directive 2004/12/EC)
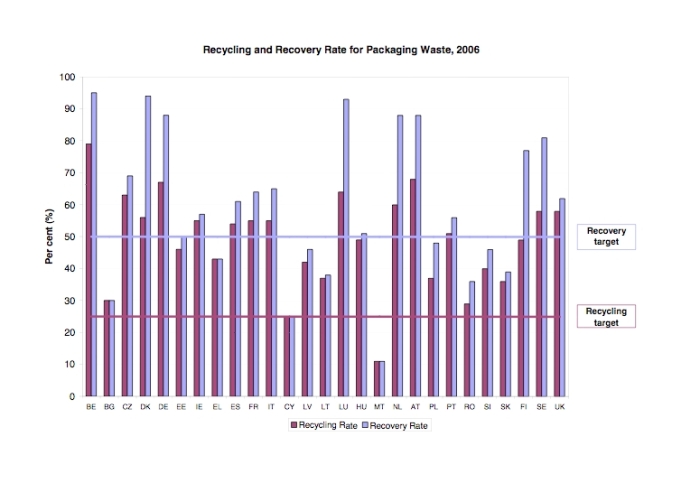
The main flow in municipal waste comes from packaging: about 60% of our waste. Targets set out by The Packaging and Packaging Waste Directive (94/62/EC, revised in 2004 by an amending Directive 2004/12/EC,) are as follows:
- Between 55 and 80% in weight of packaging waste to be recycled by no later than December 31st 2008;
- the following targets for materials contained in packaging waste must be attained: 60% in weight for glass, paper and board; 50% in weight for metals; 22.5% in weight for plastics and 15% in weight for wood by no later than December 31st 2008.
- Final EU report on the impact of climate change on options for municipal solid waste (MSW) management on the time horizon 2000 to 2020. Link: ec.europa.eu/environment/waste/studies/climate_change.htm
- Study conducted by German consultancy Ökopol on Reduction of CO2 emission potential by recycling. Link: www.euractiv.com/en/climate-change/study-reveals-potential-recycling-co2-reduction/article-169769
- Better management of municipal waste. Link: www.eea.europa.eu/publications/briefing_2008_1/at.../file
- EU website on waste directives and strategies. Link: www.eea.europa.eu/themes/waste/policy-context
- Policies and strategies on Sustainable consumption and production. Link: www.euractiv.com/en/sustainability/sustainable-consumption-production/article-172966
- EU waste management. Link: ec.europa.eu/environment/waste/studies/eucostwaste_management.htm
- Image and data on waste costs in some cities worldwide from UNEP. Link: < a href="http://maps.grida.no/go/graphic/solid_waste_management_cost_for_selected_cities1">maps.grida.no/go/graphic/solid_waste_management_cost_for_selected_cities1
- Data on waste production and treatment. Link: epp.eurostat.ec.europa.eu/tgm/table.dotab=table&init=1&plugin=1&language=en&pcode=tsdpc240
- To get an overview on incineration treatment. Link: www.eurobserver.org/downloads.asp
- Scotland's waste prevention action plan. Link: www.scotland.gov.uk/Publications/2007/02/23113217/0
- Suggestions on Home Composting:
cwmi.css.cornell.edu/composting.htm (at point Home composting a 4 p. brochure and slides)
www.gardenorganic.org.uk/composting/index.php
howtocompost.org - Best practices on prevention:
www.wastereductionweek-pilotedition.eu
www.lastminutemarket.org
ec.europa.eu/environment/waste/publications/compost_success_stories.htm - Waste Packaging:
epp.eurostat.ec.europa.eu/portal/page/portal/waste/data/wastestreams/packaging
Electric and Electronic Devices - Energy user products are targets for a specific Directive on ecodesign: 2005/32
ec.europa.eu/enterprise/eco_design/index_en.htm
Review of The Directive is ongoing. - On waste of electric and electronic equipment:
eur-lex.europa.eu/LexUriServ/LexUriServ.douri=COM:2008:0810:FIN:EN:HTML - The proposal of directive revision at:
eur-lex.europa.eu/LexUriServ/LexUriServ.do?uri=CELEX:52008PC0810:EN:NOT - Press Release Brussels 3 December 2008, IP/08/1878 at: europa.eu/rapid/pressReleasesAction.do?reference=IP/08/1878&format=HTML&aged=0&language=EN&guiLanguage=en
- For more on WEEE:
ec.europa.eu/environment/waste/weee/index_en.htm ewasteguide.info (where one finds a lot of info, data, for many European Countries and developing Countries) - To get a worldwide view on WEEE, see the sheet of UNEP (2005) at: www.grid.unep.ch/product/publication/download/ew_ewaste.en.pdf
- Bio-waste management with recent data and findings: ec.europa.eu/environment/waste/compost/index.htm
- A very usefull link list for many countries in a document: www.bvsde.paho.org/bvsacd/cd48/compost_en/part1.pdf
- On biogas:
www.eurobserv-er.org/downloads.asp www.biogasmax.eu
[ ^ Back to Summary ]
In the chart, you find the real situation in the EU about the management of this kind of waste (source: Eurostat)
The Directive affirms the extended responsibility of producers (responsibility for a product extended to the post-consumer stage), and thus in Member States, packaging producers and users are obliged to pay for every package placed on the market; this money could be used by local councils to organize collection systems and to produce education campaigns; in order to achieve the target, local councils have to organize separate collection of waste.
[ ^ Back to Summary ]
Directive 2002/96 on electrical and electronic equipment waste (WEEE)
Streams of electric and electronic devices (e-waste) represent about 4% of municipal waste but it is problematic. In the recent past, before the crisis, it was the fastest growing sector in manufacturing industry in the industrialised countries. The problem is the replacement tax and contents of hazardous substances. That’s why the EU Commission has had ad hoc legislation since 2002 (Directive 2002/96 on waste electrical and electronic equipment (WEEE)). European legislation set out 4 Kg pro capita per year as a target of recovery. In this way, e-waste could be properly treated. The Directive aims to minimize heavy metal contents (lead, cadmium chromium and flame retardants such as polybrominated biphenyls (PBB) or polybrominated diphenyl ethers (PBDE) and to promote substitution by safer alternatives for human health. The legislation provides for the creation of collection schemes where consumers return their used e-waste free of charge. The member States have implemented various kinds of scheme for a return (or take back) system. The largest recycling systems are implemented in Austria and Germany.
That’s why the EU Commission proposes a Directive revision. “More than four years later [the Directive 2002/96], only about a third of electrical and electronic waste is reported to be treated in line with these laws and the other two thirds is going to landfill and potentially to sub-standard treatment sites in or outside the European Union. Apart from losing out on valuable secondary raw materials, this is especially worrisome since inadequately treated products pose major environmental and health risks. The illegal trade to non-EU countries also continues to be widespread. Moreover many electrical and electronic products not complying with the substance restrictions have been found in the EU” (Source: Press Release Brussels 3 December 2008, IP/08/1878). That’s why the EU Commission proposes a Directive revision. [ ^ Back to Summary ]
Green paper on the management of bio-waste in the EU which lays out the state of play in bio-waste management
The organic fraction is the biggest in the waste stream (about 30% in weight). Diverting the organics out from landfill and turning them into compost can be one of the main contributions towards radically cutting greenhouse emissions from landfills and fixing carbon in European soil, severely affected by the threat of desertification. That can be done in two ways: with door to door collection of organic waste in high density areas and with extended programmes of home composting in rural areas or where there is a large presence of semi-detached houses. Such a programmes are very extended in Veneto (North Italy), in Niederösterreich, in Flanders (Belgium). In fact, the main environmental threat from bio-waste is methane emission in landfills. The waste management systems have many alternative treatments for biodegradable waste, but the best potential option is home composting, and the second option is the separate collection for industrial composting. The EU Commission is working on potential legislative proposals on bio-waste and has proposed a Green Paper on the management of bio-waste in the EU which designs the state of play in bio-waste management with recent data and findings. Coupling industrial composting and anaerobic digestion from bio-waste produces compost and biogas. With upgrading, biogas become bio-methane and in many countries (Switzerland, Germany, Sweden, the Netherlands....) it is put on the methane grid. [ ^ Back to Summary ]
Good experience
Project “100 Kg European Campaign for Waste Reduction
Prevention is very difficult to apply and even more difficult to verify if implementation is reaching the target because prevention policies are aimed at modifying individual and community habits. In fact, the initiatives which have been taken so far have not reduced annual production across Europe.
In the framework of an EU-Life+ project submitted by ADEME (Agence de l'Environnement et de la Maîtrise de l'Energie – the French Agency for Environment and Energy Management), with other partners, the pilot edition of European Waste Reduction Week was realized in 2008 and in 2009. [ ^ Back to Summary ]
"Last minute market” is a project for valorisation of unsold products in the food chain.
In Italy, “Last minute market” is a project for the valorisation of unsold products in the food chain. A brief description: This surplus is present everywhere in the food chain, from agricultural production to the retail system. Basically, this is no longer perfect to sell but it is still safe and thus perfectly edible.
The potential supply is provided by the so-called profit organizations, i.e. firms, processing industries, food shops, retail stores and the like. For these companies surplus actually represents a cost (transport and destruction of the products), while for society as a whole, a negative externality (environmental pollution). In this picture part of the (potential) demand is played by a number of charity associations or non profit organizations that directly and indirectly assist not only poor and marginal people, but also animals.
Linking surplus (supply) and deficit (demand) could counterbalance this “imbalanced” food market. A way to provide such a linkage is to create an intermediate body that acts as a counterpart for both supply (for profit organizations) and demand (non profit organizations). The scheme in which the exchange is performed works throughout as a gift transfer between profit and non profit organizations. This is the Food of Solidarity: Last Minute Market.
[….] The test was performed in large retail shops in the Bologna metropolitan area. [ …]
The model was seen to be not only useful from a social point of view but also economically viable and environmentally sustainable. Thus, the model tested was extended both in terms of shops involved and other Italian towns and regions (Ferrara, Modena, Verona, Florence, Empoli, Sicily, Sardinia) [ ^ Back to Summary ]
Link and References
About Costs
Prevention
Bio-waste